Excel Formula Help – VLOOKUP for Tracking and Presenting Student Progress
The blog follows on from our focus on Microsoft Excel tips for teachers but can very easily be adapted to track the progress of any group of individuals or performance objects.
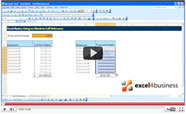
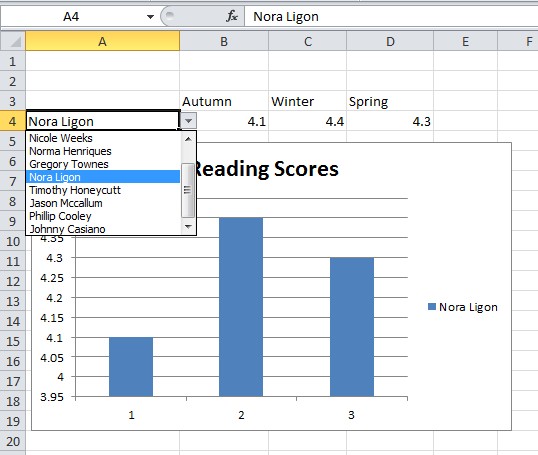
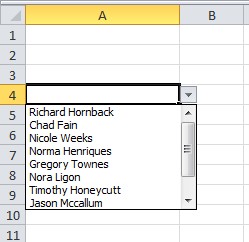
The image below shows a drop down box with names of individuals belonging to a reading class. Reading scores are taken at the end of each semester and recorded for Autumn, Winter and Spring.
During parents evening, the teacher simply selects a student and a graph showing results is generated for discussion:
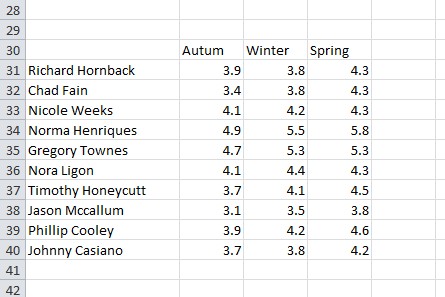
To begin, we need to add the hidden data (down page) under the relevant headings as shown in this image:
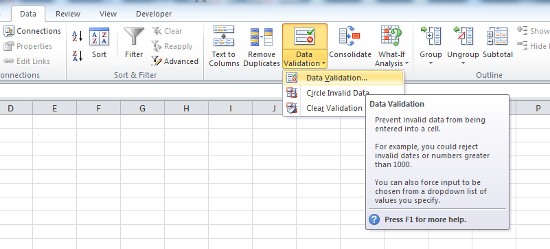
We then select e.g cell A4 and choose the Data Validation tool which allows us to specify a list for the drop down content. Select List in the Allow field:
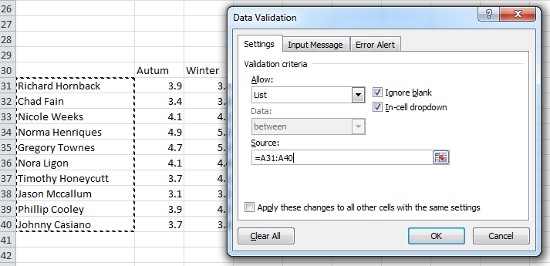
Enter the coordinates for the drop down list as shown and it will appear in A4 (you may need to click into the cell to make it appear):
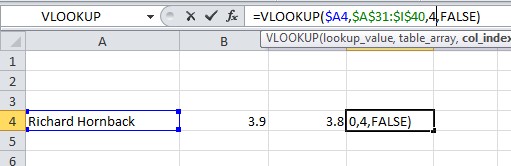
We must then extract the results so that they are listed correctly with each name we select. We do this by using the following formula, first in cell B4: =VLOOKUP($A4,$A$31:$I$40,2,FALSE) The use of $ for absolute references is covered in a previous blog here.
We then manually copy this formula into cells C4 and D4, and in doing so we increment the number 2 in the last argument by 1, to become 3 and 4 in C4 and D4 respectively, as can be seen in the diagram:
The formula is prepared for extra semesters to be added in subsequent academic years by extending the second argument to cover rows up to 'I', as can be see by the use of :$I$40. If not required, simply use the coordinates you need, for example :$D$40 You are now ready to present you results:
For further details on using the Data Validation tool, check the Microsoft help pages here. Or, of you would like comprehensive live support for your presentation projects, contact our experts here.