Excel Formula Help - Choosing between investments: An introduction to NPV (Net Present Value) and IRR (Internal Rate of Return)
Using capital investments wisely involves difficult decision processes. Forecasting means having the ability to differentiate between potential investments on various levels so that informed choices are made.
Microsoft Excel's Net Present Value, NPV, function provides a way of understanding the value of an initial investment and proceeding cash flow (profit) over time whilst factoring in a discounted interest rate related to an alternative investment, such as a fixed term bank account. A negative NPV suggests that the alternative investment would be a wiser choice.
On the other hand, Excel's Internal Rate of Return, IRR, function will tell you specifically what percentage return over the period will need to be beaten by the alternative investment to make it worthy of consideration. Should your IRR beat the alternative rate, perhaps you are better off sticking with your planned venture.
This blog will provide a very simple introduction to the NPV and IRR functions. Caution must be exercised as this introduction is simply a way to get a general idea of the concepts and use of functions; in the real world of finance both NPR and IRR are used in a slightly different way. However, if you are unfamiliar with either practice, this is a good place to start.
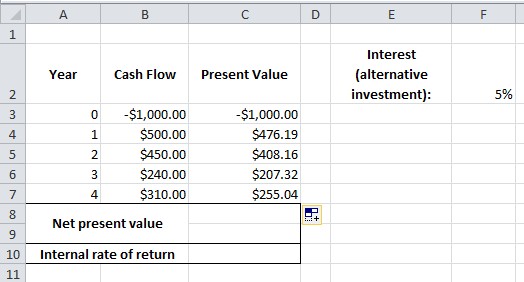
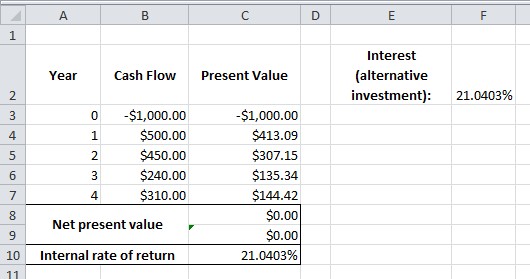
What we can see in the example below is a simplified chart that follows the cash flow of an investment over 5 years. The initial investment is $1000 which shows as a negative cash flow in year 0. Subsequent positive cash flow (profit) is listed below from years 1 to 4. To the right of the chart we have a percentage figure (green box) that represents the interest that would be available had we invested our capital elsewhere, for example, a fixed term bank account.
The question is, which is better? Should we place money in a bank account yielding 5% annually or put that capital to use in an investment?

To answer that question we need a formula that figures out the accumulated value over time of our initial investment whilst discounting the bank rate. NPV does this job. Let's walk through the process of calculating the Present Value manually year by year so that we understand clearly what is going on.
The formula in the example above takes first of all the cash flow for the period, in this case negative $1000 in cell B3. This is then divided by the competing bank rate in F2 (where 1+F2 = $105%, so B3 / 105%) - F2 is entered with conditional formatting, $F$2, to lock the cell during copy down - and raised to the power of the time period. The resulting formula for year 0 is =B3/(1+$F$2)^A3
When copied down, the formula calculates year 2, for example, as $450 / 105% = $428.57. We then simply iterate this calculation one more time to receive the two year Present Value of $408.16
Our initial negative invested amount will not change, as in formulaic terms the multiplication of something by nothing (0 years) results in no change. However, as each year passes we build up a column of Present Values.
The Net Present Value of our $1000 investment in this venture is simply the sum of all the Present Values of each year (including our initial stake is year 0), which is $346.71.
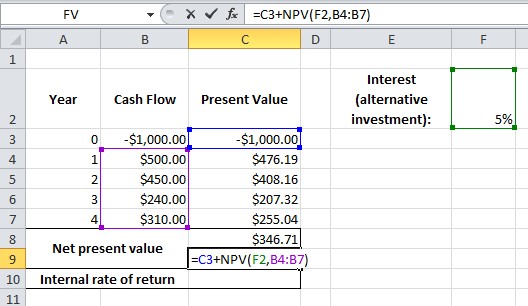
This manual process helps us understand the workings of NPV but the calculation can be more elegantly achieved by using Excel's NPV function. The formula is straight forward and takes the initial investment value from year 0 plus the NPV function, then in brackets the competing interest followed by the proceeding cash flow cells for years 1 to 4: =1000+NPV(F2,B4:B7) Again, we receive the figure $346.71.
We are now able to play with the alternative interest rate to see how NPV works. For example, by going from 5% to 15% we can see that our NPV has fallen dramatically making an investment in the venture less attractive

Which brings us to the concept of IRR. Using IRR, we can discover two things; firstly, we can see how our investment performs against the bank rate in percentage terms and secondly, we reveal exactly what percentage rate needs to be offered by an alternative investment to make it of equal value.
The IRR calculation is very simple; we invoke the function along with the cash flow cell array, such as =IRR(B3:B7) (We can ignore the 'guess' parameter).

Here find that our investment is giving us a 21.0403% return. Not bad.
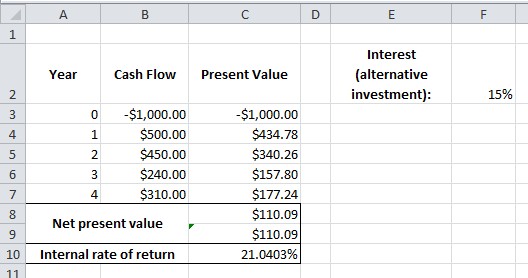
We can test this by placing the IRR percentage in the alternative investment cell. This reveals that the value of our investment would now be $0 in comparison to a (hopelessly fictitious) bank rate of 21.0403%.
Excel4Business gurus can guide you through simple or complex financial formulas that include both NPV and IRR; for more details, just give us a call. Further help with NPV and IRR can be found on the Microsoft Excel help pages.