Excel Help - How to Analyze Data in Excel 2013 with Quick Analysis
This video will show you how to analyze and edit your data with the Quick Analysis button. This button is one of the perks of Excel 2013. It allows you to analyze your data and preview formatting and other options with a single click and without searching in the ribbon.
The suggestions made by Quick Analysis are always specific to the data range you select; for instance, you’ll notice that Excel will suggest different charts for different types of data.
Select a range of cells and notice the small icon that appears in the bottom right-hand corner. This is Quick Analysis.
Click on the button to explore the options.
The Format button allows you to preview and apply different formats.
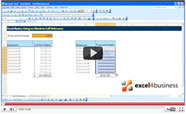
The charts buttons lets you preview and select different chart options.
The totals button allows you to preview and use some basic functions like sum and average.
The Tables button allows you to preview pivot tables.
Finally, the Sparklines button lets you preview and insert sparkline graphics.